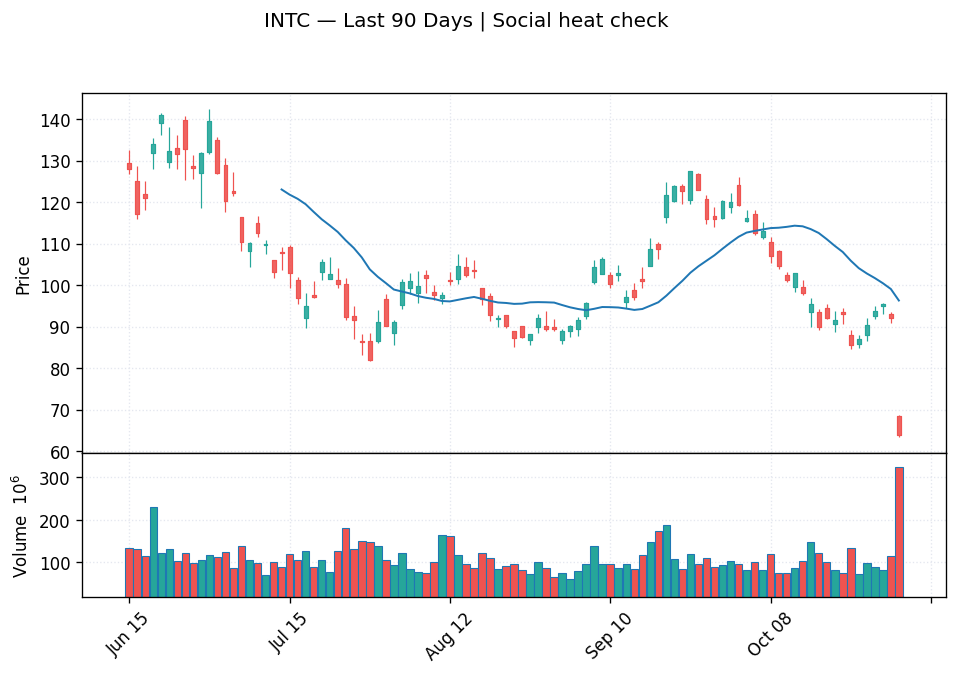
INTC is down nearly 30% in today's session — a record single-day decline — and Reddit is on fire with 34 comments versus a 30-day baseline of roughly 3. Our composite investment score sits at 45.7 out of 100 (HOLD), no backtest-validated buy signal is currently active, and the technicals are flashing extreme oversold without yet showing a base. The hype is real. The entry isn't — yet.
The Hype: 15 Standard Deviations Above Normal
When a stock generates Reddit chatter running 15.2 standard deviations above its own 30-day average, that's not organic discussion — that's a crowd event. Today's 34 INTC comments against a baseline of roughly 3 per day puts this squarely in "meme momentum" territory, the kind of spike that historically correlates more with late-stage panic buying than with durable bottoms.
StockTwits is running 200 messages over the past seven days, leaning 61% bullish to 39% bearish. Twitter, meanwhile, is carrying real-time headlines of Intel's credit default swap widening to a record 123.5 basis points — a measure of institutional fear about Intel's credit health, not a retail sentiment gauge. Those two data streams are telling very different stories, and the divergence matters.
The retail crowd smells a bounce. The bond market is pricing in existential risk. When those two disagree this sharply, it's worth slowing down and letting the data lead.
What Our Data Actually Says
Intel's composite investment score is 45.7/100 — a HOLD, not a buy. Breaking that number apart is where it gets instructive:
- Technical score: 25/100. This is the weakest sub-score in the model. The 5-day trend is in outright breakdown, down 29.5%. The 20-day trend is down 45.1%, with the stock trading well below both its 20-day SMA ($96.32) and 50-day SMA ($101.08). On the 100-day view, INTC is sitting more than two standard deviations below its own trend — the model labels this EXTREME_OVERSOLD, with relative strength rated VERY_WEAK.
- Fundamental score: 51/100. Middling — not a disaster, but not the kind of fundamental conviction that underwrites a falling-knife catch. Wall Street's mean price target is $117.71 (as of today), implying significant upside from recent pre-crash levels, but analyst estimate dispersion is wide: the low target is $80, the high is $200. That range reflects genuine uncertainty about Intel's trajectory, not a consensus thesis.
- Options flow score: 69/100. This is the one number that looks constructive — but the flow signal is labeled distribution, not accumulation. RSI has collapsed to 24.6. Elevated options activity in a distribution regime means traders are buying downside protection and expressing bearish views through the options market, not positioning for a recovery.
- Momentum score: 55/100. Neutral on its own, but momentum scores are lagging in a session where the stock has just printed its worst single-day decline on record. This number will look materially worse in tomorrow's overnight update.
To be direct: none of our backtest-validated buy signals currently hold INTC. Our models are designed to identify stocks building bases and pulling back from strength — not stocks in freefall. Buying a stock down 30% in a session can work, but it requires a confirmed stabilization structure that does not yet exist here.
Intel's 5-year credit default swap widened to a record 123.5 basis points today, its largest single-day move since October 2022. CDS levels at this magnitude reflect institutional uncertainty about balance-sheet durability. For equity investors, this is a reminder that a cheap price and a safe price are not the same thing. Intel carries significant debt, is in the middle of a costly multi-year foundry buildout, and is burning cash in a competitive environment against TSMC, AMD, and now NVIDIA on the data-center side. A 30% share-price decline does not automatically make a stock a value opportunity — it can also be the market repricing a fundamentally altered risk profile.
The Level That Would Change Our Mind
Our bottoming-style signals engage when a stock demonstrates price stabilization, improving breadth, and institutional re-accumulation — not on the day of maximum panic. For INTC specifically, here is what we would need to see:
The key structural support the trendline model identifies is $63.50, which has acted as the primary floor on both the 20-day and 100-day views. The stock is currently trading just above that level. A close above $63.50 — not just an intraday visit — with declining volume over the following sessions would be the first sign that sellers are exhausting themselves.
On the options side, the put wall sits at $60 with open interest of nearly 976,000 contracts. That strike is acting as a gravitational anchor for market maker hedging activity. If INTC tests $60 and holds — particularly with a multi-day consolidation above that level — it would represent the kind of structure our signals are calibrated to identify as a potential base. The call wall at $70 (over 1.3 million contracts in open interest) marks the first meaningful overhead resistance; any recovery attempt will face friction there.
In plain terms: a close and hold above $63.50, followed by a confirmed stabilization pattern over several sessions, is the earliest-plausible setup. The $60 level is the line in the sand below that. If INTC loses $60 on a closing basis, the next technical reference is substantially lower.
Key Levels
| Level | Price | Significance |
|---|---|---|
| Put Wall (major support) | $60.00 | 975,993 contracts in OI; market maker hedging anchor |
| Trendline Support | $63.50 | 20-day and 100-day model support; must hold on a closing basis |
| Current Price (approx.) | ~$63.80 | Trendline data; live session price, subject to change |
| Call Wall (first resistance) | $70.00 | 1,324,904 contracts in OI; recovery attempts will face selling pressure here |
| 20-Day SMA | $96.32 | Far overhead; reclaiming this would signal a genuine trend reversal |
| Analyst Mean Price Target | $117.71 | Wall Street consensus (as of Oct 30, 2026); wide dispersion ($80–$200) |
Bottom Line
INTC's Reddit surge is a sentiment event, not a signal. The stock is printing its worst single-day decline on record, the technical score sits at 25/100, and no validated buy signal is active in our models. The data isn't saying Intel is a broken company forever — analyst EPS estimates have actually seen 27 upward revisions against just 2 downgrades over the past 30 days, which is a genuinely constructive fundamental signal for the longer-term recovery thesis. But fundamentals don't set your entry price; price action does. Watch $63.50 as the line that needs to hold, and $60 as the deeper support the options market is defending. A multi-session base above either level — with stabilizing volume and improving breadth — is the setup worth acting on. Today's open is not.
This article was generated by Tradestie Alpha Assistant using live market data (scanner signals, backtested hit rates, options positioning, and fundamentals). Backtest statistics describe historical cohorts, not guarantees. It is for informational purposes only and is not financial advice. Do your own research before making investment decisions.