Chart Patterns Today
Every trading day we scan 25 of the most liquid US stocks and ETFs for clean wedge, triangle and channel setups. Only high-quality formations make the cut — most days that's one chart, some days none. Each chart shows the projected breakout path and measured-move target, with the pattern's actual historical break-direction frequency from our 76,000-day backtest.
2026-09-19
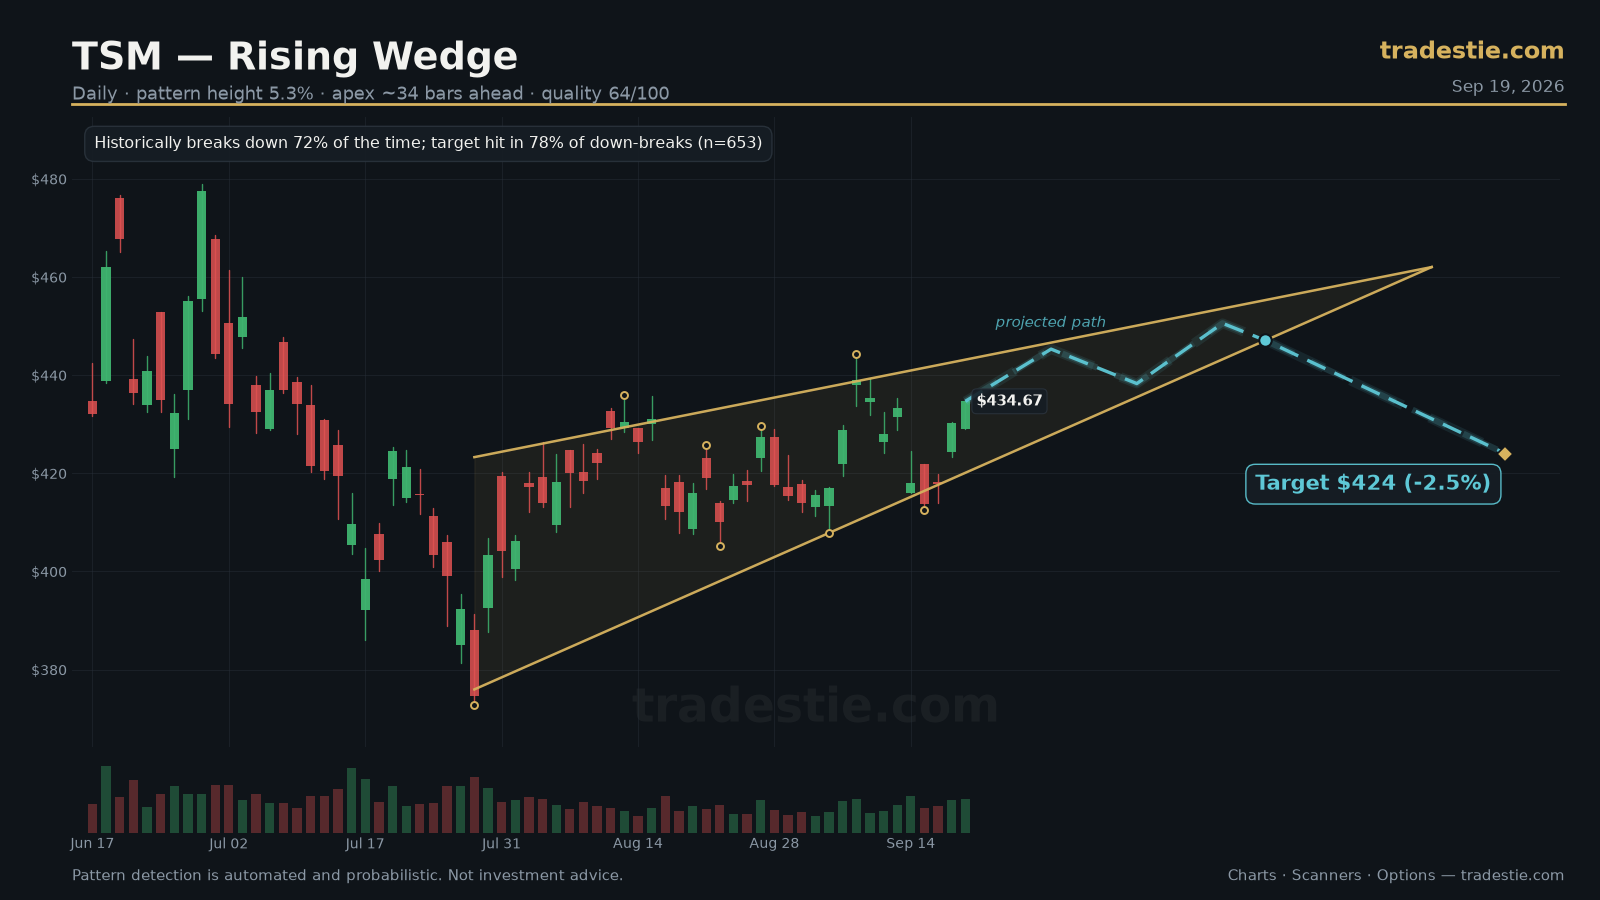
How to read these stats. The percentages on each chart are historical
break-direction frequencies and target-hit rates — e.g. "falling wedges broke upward 63%
of the time." They are not win rates and not return predictions: our backtest
found no forward-return edge from pattern detection alone. Use these charts as scenario
maps for levels and invalidation, not as buy/sell signals. Not investment advice.