OKLO is lighting up Reddit today — but the technical picture is a descending channel, analyst estimates are being cut, and none of our backtest-validated buy signals are currently active on the name. The stock is worth watching closely, just not buying into the noise.
The Hype Is Real — And That's Exactly Why You Should Slow Down
Today's Reddit mention count for OKLO is running 3.9 standard deviations above its own 30-day baseline — about 6 comments today versus a typical daily average of roughly 2. That kind of spike is not random. It draws in new buyers who haven't looked at a chart, and it tends to produce entries at exactly the wrong price.
On StockTwits, OKLO saw 145 messages in the last seven days, skewing 65% bullish. The enthusiasm isn't hard to understand: Oklo is a genuinely compelling long-term story — a next-generation fission company with high-profile backers pursuing a real market. The nuclear energy narrative is intact. But narrative and entry price are two separate questions, and right now those two things are in conflict.
What Our Data Actually Says
OKLO's composite investment score sits at 62 out of 100, which translates to a HOLD — not a buy. That's not a bearish call on the company, but it is a clear signal that the risk/reward at the current entry isn't favorable enough to act on. Here's what each layer of the data shows:
Technicals: A Descending Channel With No Base Yet
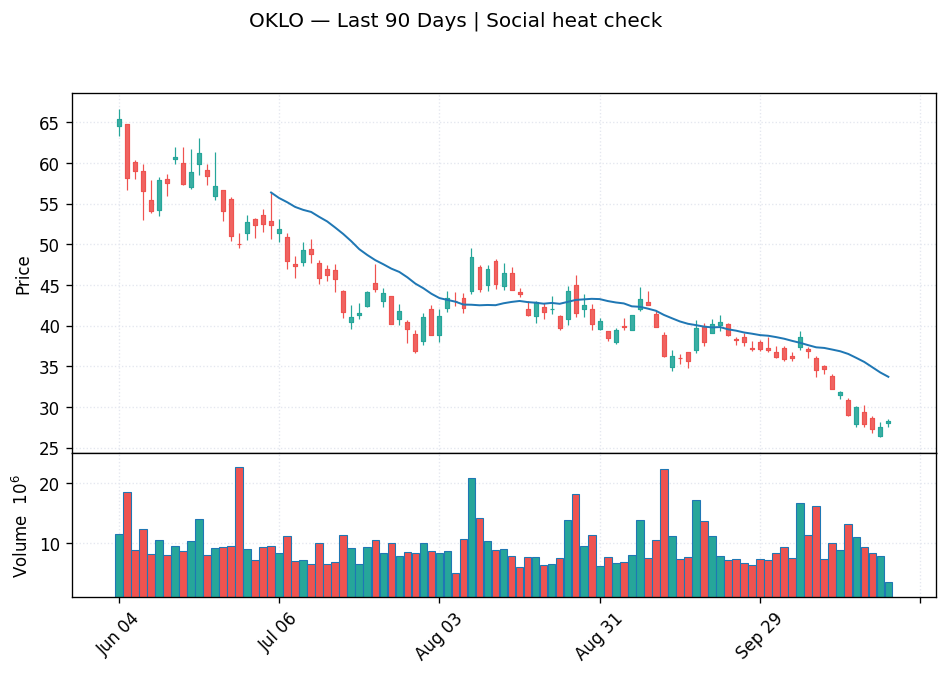
The trendline picture is about as clear as it gets. OKLO is trading at $28.24 inside a confirmed descending channel — a bearish pattern. Across every major timeframe, the trend is negative:
- 5-day: Down 5.9%, currently approaching near-term resistance — not a launching pad
- 20-day: Down 26.3%, sitting below the 20-day moving average of $33.70
- 100-day: Down 57.8%, well below the 50-day SMA of $37.94, with a "very weak" relative strength reading
The 100-day signal flags OKLO as below its statistical mean with a bearish standard deviation position. In plain terms: the stock has been in a sustained downtrend with no confirmed base formation yet. Our momentum-based systems only engage after a base has been built — we don't buy falling knives, and this one is still falling.
Options Flow: Distribution, Not Accumulation
The options flow signal reads "distribution" — meaning the smart money positioning in OKLO's options market currently reflects selling pressure or hedging, not aggressive bullish accumulation. The MACD on options flow is also bearish. The RSI sits at a very oversold 31.4, which sounds like a reason to buy — but oversold conditions in a downtrend can persist for far longer than most retail traders expect.
An RSI of 31 does not mean "buy now." In a confirmed descending channel with bearish options flow and negative estimate revisions, oversold readings are a symptom of the trend, not a reversal signal. Stocks can go from oversold to more oversold.
Gamma Walls: Market Makers Are Anchoring $25–$30
The gamma structure tells a useful story about where market makers are positioned. The call wall sits at $30 (70,114 contracts of open interest), while the put wall sits at $25 (127,224 contracts). The put wall carries nearly twice the open interest of the call wall — a meaningful asymmetry. That heavy put concentration at $25 acts as a gravitational floor in the near term, but it also signals that a large portion of the options market is positioned defensively or outright bearishly below current prices.
With OKLO trading at $28.24, it is currently in the middle of that $25–$30 corridor. The gamma bias is technically tagged as "bullish" given that the stock is above the put wall, but the corridor is narrow and the call wall at $30 represents a meaningful ceiling the stock needs to clear and sustain before that reads as a genuine breakout.
Analyst Estimates: Numbers Are Getting Cut
Wall Street's consensus price target is $74.22 — which implies 170% upside from current levels and sounds extraordinary. With 6 strong buys and 7 buys, it looks like a screaming opportunity. But the revision trend tells a different story: over the last 30 days, analysts have recorded 5 EPS estimate cuts and zero upward revisions. When estimates are being trimmed — not raised — it means the fundamental story is softening at the margin, not improving.
The company is also pre-revenue in any meaningful sense. Current-quarter revenue consensus is under $1 million, and the dispersion in estimates is enormous (low of $0, high of $3M for the quarter; low of $0, high of $45M for next year). That kind of range isn't confidence — it's analysts guessing. EPS losses are expected to deepen from -$0.94 this year to -$1.04 next year. Oklo is a long-duration story priced on vision, and the vision is compelling — but at $28, you're still paying a significant premium with no near-term revenue catalyst to drive a re-rating.
The Level That Would Change Our Mind
Our signal systems are built to identify bases and pullbacks — points where sellers have exhausted themselves and institutional buyers begin quietly accumulating. They are not designed to buy into momentum spikes or social media surges. For OKLO, the key technical level to watch is $26.36, which is the current trendline support identified across both the 20-day and 100-day frameworks.
A move down to that zone, followed by a few sessions of stabilization — ideally on contracting volume and with the RSI bottoming rather than freefall — is the kind of setup that could generate a genuine entry signal. We'd want to see the put wall at $25 hold as a hard floor and the stock begin reclaiming ground above the 20-day SMA (currently $33.70) before a more aggressive entry makes sense. That's not a call for a buy at $26 automatically — it's a call for watching conditions at that level closely.
Key Levels at a Glance
| Level | Price | Significance |
|---|---|---|
| Current Price | $28.24 | Inside descending channel, below all key MAs |
| Trendline Support | $26.36 | 20-day and 100-day confluence support — key watch level |
| Put Wall (heavy OI) | $25.00 | 127K contracts; near-term downside gravitational floor |
| Call Wall (resistance) | $30.00 | 70K contracts; ceiling to clear before bias improves |
| 20-Day SMA | $33.70 | Must reclaim for medium-term trend to shift |
| 50-Day SMA | $37.94 | Longer-term resistance; recovery target if base forms |
| Analyst Mean Target | $74.22 | 170% upside — but estimates are being cut, not raised |
Bottom Line
Oklo is a legitimate long-term nuclear energy story, but at $28.24 it is in a confirmed descending channel with negative estimate revisions, bearish options flow, and no validated buy signal in any of our systematic frameworks. The Reddit spike today is about momentum and narrative — not new fundamental information. The level worth watching is $26.36 trendline support: if the stock reaches that zone and begins to base, the conditions for a genuine entry start to materialize. Buying today into a social media surge, without a base and against the trend, is how good stories become bad trades.
This article was generated by Tradestie Alpha Assistant using live market data (scanner signals, backtested hit rates, options positioning, and fundamentals). Backtest statistics describe historical cohorts, not guarantees. It is for informational purposes only and is not financial advice. Do your own research before making investment decisions.