Kinder Morgan (KMI) has triggered our XLE Bullish scanner as of October 7, 2026 — a signal with a published 62.6% positive-outcome rate over 334 backtested entries and a median 20-day excess return of +3.79% vs. the S&P 500. With just one Reddit mention today, this is not a crowded hype trade — it's a quiet technical setup worth tracking with eyes open on the risk.
The Signal
The XLE Bullish scanner fires when a stock in the energy sector meets a converging set of technical conditions consistent with institutional accumulation — price stabilizing above key moving averages, options flow tilting bullish, and sector money flow supportive. It is designed to identify stocks in the early stages of a base or recovery, not to catch breakouts after the move has already occurred.
Our backtest over 334 entries shows:
- 62.6% of entries were positive after 20 trading days
- Median excess return vs. SPY: +3.79% over the same 20-day window
That is a meaningful edge — not a coin flip — but a 37.4% loss rate means position sizing and pre-defined exit levels are non-negotiable. The signal identifies opportunity, not certainty.
The Setup
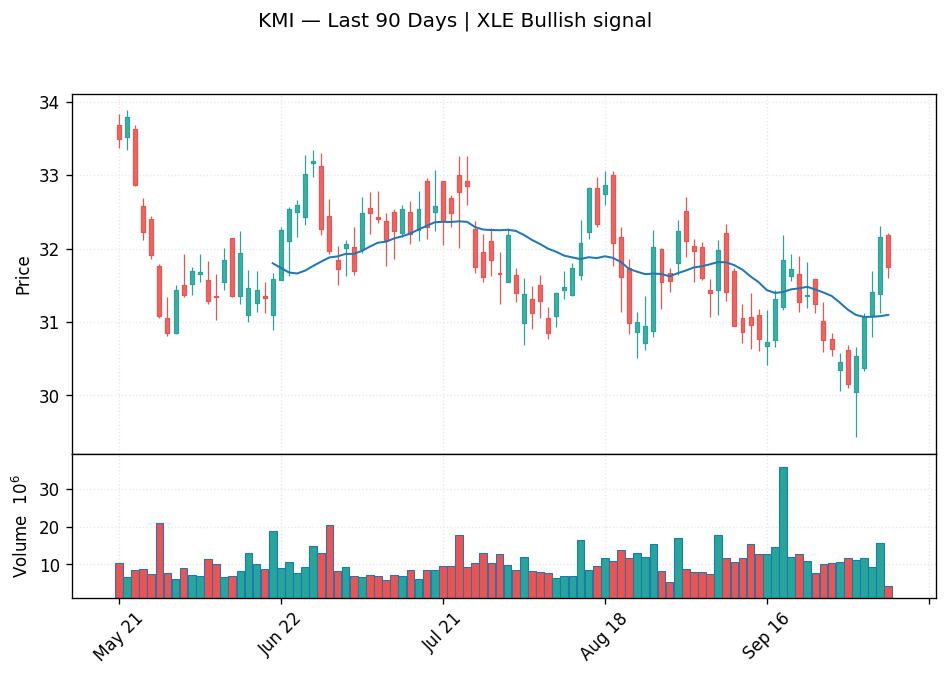
KMI is currently trading at $31.755, sitting in an interesting technical position: the 5-day and 20-day trends are both pointing up (+4.0% and +2.6% respectively), but the 100-day trend remains a moderate downtrend (-5.6% over that window). That divergence is exactly the kind of bottoming base these signals are designed to surface — the short-term momentum is turning before the longer-term picture has fully cleared.
The stock is trading above its 20-day simple moving average of $31.10 and within striking distance of its 50-day SMA at $31.46. The trendline scanner flags a "Near Breakout" pattern (WATCH signal), with the key resistance shelf sitting at $32.31. A clean, sustained push through that level on volume would mark the transition from base-building to confirmed uptrend.
Importantly, KMI's 100-day channel shows price above the mean of that channel — a bullish standard-deviation signal even within the broader downtrend — suggesting the stock is beginning to reclaim lost ground rather than simply dead-cat bouncing. The RSI reads 56.2, healthy momentum without being overbought.
The fundamental backdrop is quietly supportive. The consensus analyst EPS estimate for the current fiscal year sits at $1.558, implying approximately 19.8% year-over-year growth vs. last year's $1.30. Revenue for this year is modeled at roughly $18.3 billion, up ~8.3% — not explosive growth, but steady and above-consensus revision momentum is notable: over the last 30 days, analysts have issued 14 upward EPS revisions versus only 3 downward, a net revision score of +11. Estimates are moving in the right direction.
What the Options Market Says
The options flow score for KMI registers at 66 out of 100, with the MACD signal on flow reading bullish. The overall flow signal is described as "mixed," which is consistent with a stock in early-stage recovery rather than one already in a confirmed uptrend — smart money is leaning in, but conviction isn't one-sided yet.
The gamma wall structure is notably constructive. Dealers are short a large call position at the $35 strike (open interest: 227,116 contracts), which acts as a magnetic ceiling — price tends to get pulled toward high-OI strikes as expiration approaches. The put wall sits at $30 (OI: 53,678 contracts), providing a floor where dealer hedging activity tends to cushion downside.
The corridor between $30 and $35 represents where dealer positioning is likely to concentrate and contain near-term price action. The gamma bias is flagged as bullish, meaning dealers are more likely to be buyers of KMI on dips than sellers — a tailwind for the setup.
Key Levels to Watch
| Level | Price | Significance |
|---|---|---|
| Near-term resistance | $32.31 | 20-day trendline ceiling; breakout trigger |
| 100-day resistance | $31.83 | Shorter-term overhead supply from the longer trend |
| Current price | $31.755 | Trading between 20-day SMA and near-term resistance |
| 50-day SMA | $31.46 | First pullback support to watch |
| 20-day SMA | $31.10 | Bull/bear line for short-term trend |
| 100-day support | $31.04 | Structural floor; losing this would be a concern |
| Put wall / gamma floor | $30.00 | Dealer positioning support; key downside risk level |
| 20-day trendline support | $29.43 | Deeper support; signal invalidation zone |
| Call wall / upside magnet | $35.00 | High-OI ceiling; analyst mean target nearby at $36.09 |
What Would Invalidate It
Three conditions would signal the setup has failed and the thesis should be abandoned. First, a daily close below $30.00 — losing the put wall support on a closing basis shifts dealer hedging from supportive to potentially accelerating — would materially undermine the near-term technical case. Second, a close below $29.43 (the 20-day trendline support) would fully negate the base-building pattern that triggered this signal. Third, a sharp deterioration in energy sector flow — such as a breakdown in crude prices or a sudden reversal in XLE itself — would invalidate the sector tailwind the scanner depends on, regardless of where KMI's price sits. If any of these occur, this is not a signal to hold and hope; it's a signal that the thesis was wrong.
Bottom Line
KMI is building a quiet base at $31.755, with short-term momentum turning positive, upward analyst revisions accelerating (14 upgrades vs. 3 downgrades in 30 days), bullish dealer gamma positioning between $30 and $35, and a Wall Street consensus target of $36.09 — implying roughly 12.2% upside from current levels. The XLE Bullish signal that flagged this setup carries a 62.6% win rate and median +3.79% excess return vs. SPY over 20 days across 334 historical entries. If KMI holds above $30.00 and clears $32.31 on volume, the path toward the $35 call wall — and eventually analyst targets near $36 — becomes structurally well-supported. The key risk tripwire is a close below $30.00. We will track this entry publicly against the backtest benchmarks.
This article was generated by Tradestie Alpha Assistant using live market data (scanner signals, backtested hit rates, options positioning, and fundamentals). Backtest statistics describe historical cohorts, not guarantees. It is for informational purposes only and is not financial advice. Do your own research before making investment decisions.