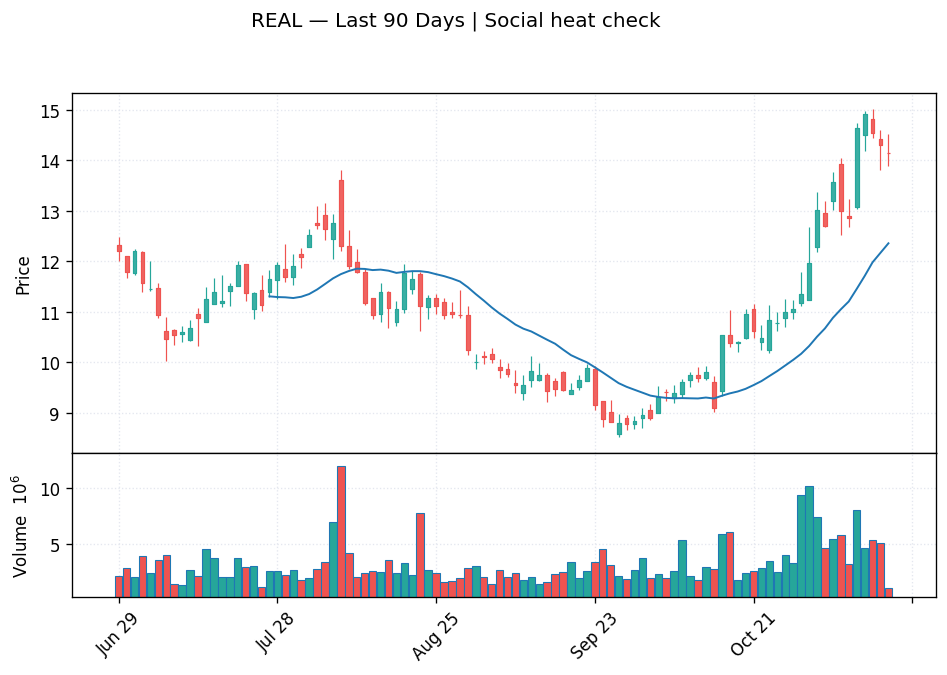
Bottom line upfront: REAL (The RealReal) is a legitimate turnaround story with improving fundamentals — but at $14.14, the stock has already run nearly 39% off its October low, the chart is technically extended, and none of our validated buy signals are currently active. The Reddit buzz is real; the entry point is not.
The Hype: What Reddit Is Actually Seeing
REAL is one of the most-discussed names on Reddit today, with mention volume running approximately 7.0 standard deviations above its own 30-day baseline — roughly 4 comments in the current session against a daily average closer to 1. That kind of spike almost always means one of two things: a sharp price move that caught retail traders off-guard, or a narrative catalyzing rapid sharing. Here, it's both.
The stock surged +13.8% on November 9 — a single-session move that often seeds exactly this kind of social acceleration, as latecomers try to figure out whether they missed the trade. StockTwits chatter is uniformly bullish, with one post already floating a price target of $22. Social sentiment across platforms sits at an overall bullish lean with a composite score of 0.25.
None of that makes it a buy. It makes it worth examining carefully.
What Our Data Actually Says
Investment Score: 36/100 — EXTENDED
Our composite score for REAL sits at 36 out of 100, and the system flags it as EXTENDED — not a buy setup, not a short, but a stock that has moved ahead of where high-probability entries typically emerge. The sub-scores tell the story clearly: the technical component scores 0, reflecting a chart that has outrun near-term support, while the fundamental component comes in at a more respectable 33. The one genuinely bright spot is options flow, which scores 69 — meaning smart money positioning in the options market leans constructive.
Critically, none of our backtest-validated buy signals currently hold REAL. Our models buy bases, clean pullbacks, and volume-absorption patterns — the kind of setups that form after a run consolidates. REAL has not built that base yet.
Trendline Picture: Real Strength, Real Extension
The 20-day trend is undeniably strong — REAL is up +37.7% over that window, with the price at $14.14 sitting well above its 20-day support at $12.69 and its 50-day moving average at $10.62. The 100-day trend is sideways with a weak strength reading, and the standard deviation positioning is explicitly flagged as ABOVE 1STD — the chart's own way of saying the near-term move is stretched. The 5-day trend is up but near support, and the stock is already down three sessions in a row from its recent high of $15.01 on November 11.
RSI sits at 68.4 — not in textbook overbought territory, but close, and in the context of a 39% run from the low, it argues for patience over urgency.
Options Positioning: Bullish Bias, But a Hard Ceiling Nearby
The options market's gamma structure shows a call wall at $15.00 with open interest of 32,479 contracts — an enormous concentration sitting just 6% above the current price. That level acts as a magnet and a ceiling simultaneously: it tends to draw price toward it, but heavy call-side open interest at a round number also creates dealer hedging pressure that can cap short-term upside. The put wall sits at $12.50, which defines the lower boundary of market maker gamma exposure. The overall gamma bias is bullish, consistent with the options flow score, but the structural range between $12.50 and $15.00 is tight, and REAL is already in the upper half of it.
The $15.00 call wall represents the most concentrated options open interest in REAL's current structure. With the stock already at $14.14 and three consecutive down sessions since touching $15.01, there is meaningful resistance immediately overhead. Chasing here risks buying into the ceiling, not through it. A failure to break and hold above $15 could see the stock retrace toward the $12.50–$12.69 zone where real structural support exists.
Analyst Consensus: Genuinely Positive, But Already Reflected
Wall Street is not bearish on REAL — far from it. The consensus among 9 analysts shows 7 buys and 2 holds, zero sells, with a mean price target of $17.75 (median $18.00) and a high target of $20.00. That implies roughly 24% upside to the mean from current prices. EPS estimate revisions over the last 30 days are strongly positive: 10 upward revisions against just 1 downward, with the current-year EPS estimate climbing from $0.099 thirty days ago to $0.120 today. Revenue is expected to grow +16.9% this fiscal year and another 10.9% next year — a credible acceleration for a luxury resale marketplace that has taken years to find its profitability footing.
The fundamental trajectory is real. The question is not whether REAL is a good company right now — it's whether $14.14 is the right price to own that thesis, or whether a pullback to support would offer a meaningfully better risk-reward.
The Level That Would Change Our Mind
Our validated buy signals — the ones with actual backtest edges — engage on pullbacks that hold structure: volume-absorption at support, tight consolidations, and recovering pullbacks where sellers have been exhausted. For REAL, the two levels worth monitoring are:
- $12.69 — the 20-day trendline support. A pullback here that holds for 2–3 sessions with declining volume and a constructive close would be the first signal worth watching.
- $12.50 — the options put wall. This is where dealer hedging activity would naturally intensify on the downside, providing a potential floor. A test of this level with stable or rising options flow would meaningfully improve the setup profile.
Conversely, if REAL can trade through $15.00 on volume and hold it for a session or two — turning that call wall from resistance into support — that breakout scenario would also be worth engaging, as the gamma dynamic would flip from ceiling to launch pad.
Key Levels at a Glance
| Level | Price | Significance |
|---|---|---|
| Call Wall / Resistance | $15.00 | 32,479 contracts OI; ceiling until broken on volume |
| Current Price | $14.14 | Down 3 sessions from $15.01 high; extended vs 20-day support |
| 20-Day Trendline Support | $12.69 | First meaningful pullback target; buy-signal zone |
| Put Wall / Structural Floor | $12.50 | Options gamma support; defines lower boundary of current range |
| 50-Day Moving Average | $10.62 | Deeper support; only relevant on a broader breakdown |
| Analyst Mean Target | $17.75 | Consensus upside; 24% from current price |
Bottom Line
REAL's fundamentals are improving — revenue accelerating, EPS estimates revised sharply higher, analysts bullish with a $17.75 mean target — and the longer-term story is worth following. But at $14.14, the stock is nearly 39% above its October low, technically extended above one standard deviation, and pressing directly against a heavy $15.00 call wall with no validated buy signal currently active. The setup that would justify entry is a pullback to $12.50–$12.69 that holds and builds a base, or a confirmed volume breakout above $15.00. Chasing Reddit buzz at a resistance ceiling is not the trade — the level is.
This article was generated by Tradestie Alpha Assistant using live market data (scanner signals, backtested hit rates, options positioning, and fundamentals). Backtest statistics describe historical cohorts, not guarantees. It is for informational purposes only and is not financial advice. Do your own research before making investment decisions.