Micron Technology (MU) has triggered our SOXX Bullish scanner as of November 13, 2026 — a signal that has resolved positively 57.5% of the time over 678 backtested entries, with a median excess return of +1.90% versus the S&P 500 over the following 20 trading days. The stock is not breaking out. It is building a potential base after a significant drawdown — which is exactly the type of price structure this scanner is designed to identify. What follows is the full setup, the levels, the options positioning, the supply-chain context, and critically, what would invalidate the trade.
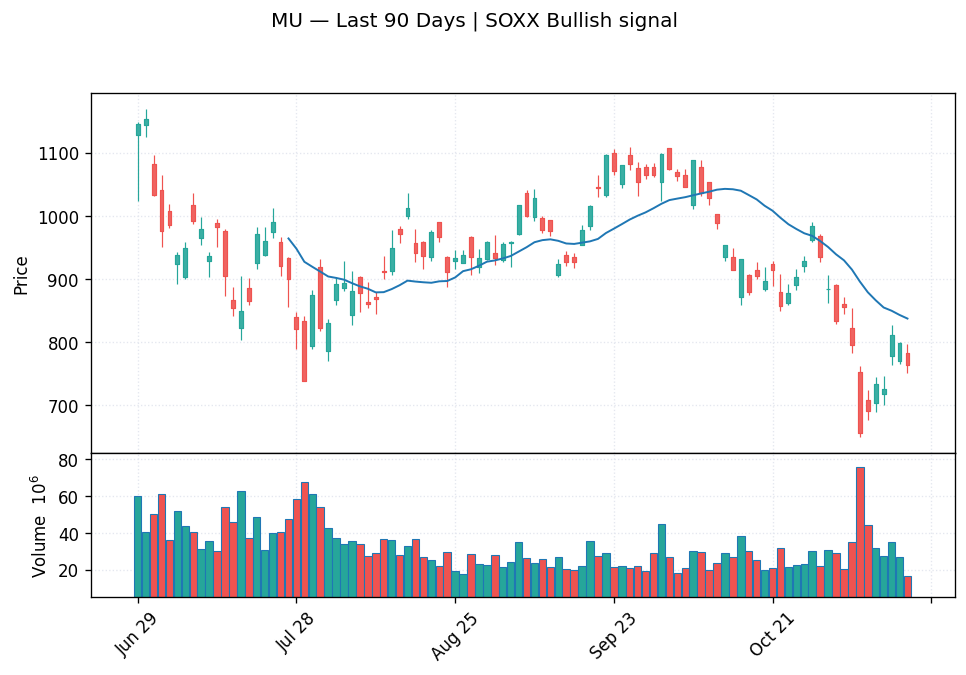
The Signal
The SOXX Bullish scanner fires when a semiconductor stock within the Philadelphia Semiconductor Index universe meets a confluence of momentum recovery, volume, and relative-positioning criteria. It is explicitly designed to catch early-stage bottoming setups — not momentum continuation plays — which matters for how you read the current MU chart.
Our backtested results across 678 entries: 57.5% of signals resulted in a positive outcome after 20 trading days. The median excess return versus SPY over that same window was +1.90%. That is a modest but statistically meaningful edge — roughly six points above a coin flip — with the alpha accruing through sector-relative outperformance rather than raw momentum. It is an edge worth tracking, not a guarantee worth sizing recklessly.
One additional data point worth noting: Reddit mentions for MU today sit at just 4 — near its baseline. This is not a signal being driven by retail chatter or social-media hype. The setup is technical, not narrative-driven.
The Setup
MU is currently trading around $764, sitting below its 20-day resistance at $827.58 and well below 100-day resistance at $900.83. That framing is important: this is a stock in a downtrend on the intermediate and long-term frames, trying to stabilize. The 100-day trend shows a price change of -37%, and MU is trading below its mean on that timeframe — the technical model flags this as "below mean, bearish" on the longer frame.
What gives the signal its footing is the near-term action. The 5-day trend has turned UP, with price near support and a 4.2% recovery off recent lows. The 20-day trend, while still down at -15.6%, has a defined floor: $689.65 is the 20-day support. These signals specifically target situations where a stock has been beaten down and is showing early signs of stabilization — this is that setup.
MU's composite investment score stands at 56.5 out of 100 (BUY), with sub-scores of 61 on technicals, 57 on fundamentals, and 57 on options flow. The RSI is at 41.4 — not yet oversold at 30, but meaningfully compressed — which confirms the stock is coming from a place of recent weakness, not from an extended run.
What the Options Market Says
Dealer positioning gives us a useful corridor for near-term price behavior. The call wall sits at $900 (open interest: 65,826 contracts), while the put wall is anchored at $750 (OI: 37,386 contracts). The overall gamma bias is flagged as bullish by our dealer-flow model — meaning dealers are likely to act as buyers on dips toward $750, providing a natural floor, and sellers into strength approaching $900.
Think of these levels as a dealer-positioning corridor, not a forecast: price is more likely to gravitate toward these walls than blow through them in the near term absent a significant catalyst. The $750 put wall is the first line of defense. If that level fails to attract buying, the setup weakens materially.
The options flow score reads 57 — slightly positive, but the flow signal is flagged as "distribution," and the MACD signal is bearish. This is a mixed options picture: gamma positioning is supportive, but active flow hasn't turned aggressively bullish yet. That is consistent with an early-stage bottoming setup where smart money is positioning quietly rather than loudly.
Supply-Chain Position: Why MU Is a Chokepoint
This is where MU's thesis gets structural. In our semiconductor supply-chain knowledge graph, Micron scores 8 out of 10 on bottleneck score — an oligopoly position in memory that cannot easily be replicated or substituted. Memory is not a commodity in the way casual observers assume. The design, process technology, and manufacturing scale required to produce competitive DRAM and NAND at volume means the global market effectively comes down to three players: Samsung, SK Hynix, and Micron.
Micron's key customers include Apple (AAPL), NVIDIA (NVDA), Qualcomm (QCOM), and Dell (DELL). When NVIDIA scales out HBM-enabled GPU clusters for AI inference, Micron is in the critical path. When Apple ships a new iPhone generation, Micron's mobile DRAM goes in. These are not easily redirected supply chains.
On the technology side, MU's key assets include High-Bandwidth Memory (HBM), DDR5 DRAM, and 3D NAND — all of which are at the center of AI infrastructure buildout. HBM in particular is the bottleneck-within-a-bottleneck: it sits physically on the GPU die in systems like NVIDIA's H100 and B200, and production capacity is constrained by advanced packaging, not just wafer starts. Micron is one of three firms on earth capable of supplying it at scale.
MU's suppliers — ASML, Applied Materials (AMAT), Lam Research (LRCX), and KLA (KLAC) — are themselves chokepoints, which means MU's supply chain is both constrained and defensible. That 8/10 bottleneck score reflects a moat that is structural, not cyclical.
What Analysts Expect
Wall Street's conviction on MU is striking. Of 49 analysts with active ratings, 45 are Buy or Strong Buy, 4 are Hold, and zero are Sell. The consensus price target is $1,561, implying roughly 96% upside from current levels — an unusually wide gap between price and consensus that reflects either a market mis-pricing or a street that has gotten ahead of its skis on the cycle recovery timeline.
Critically, estimate revision momentum is strongly positive: over the past 30 days, analysts have submitted 83 upward EPS revisions against only 8 downward revisions — a net of +75. Current-year EPS estimates have moved from $155.79 ninety days ago to $176.50 today. Revenue is expected to have more than doubled year-over-year in the current quarter. The fundamental story is not broken — it's a matter of whether the stock is ahead of or behind the cycle.
Key Levels to Watch
| Level | Price | Significance |
|---|---|---|
| Call Wall (Resistance) | $900 | Dealer gamma ceiling; 65,826 OI contracts |
| 20-Day Resistance | $827.58 | First meaningful overhead; must clear for momentum shift |
| Current Price | ~$764 | Base-building zone; 5-day trend turning up |
| Put Wall (Support) | $750 | Dealer floor; 37,386 OI contracts — key line in the sand |
| 20-Day Support | $689.65 | Setup support floor; a close below here weakens thesis |
| 100-Day Support | $650.00 | Deeper structural support; full stop-loss zone |
What Would Invalidate This Setup
This signal is designed for bottoming setups — it carries real downside risk if the base fails. Specifically: a weekly close below the put wall at $750 would remove the primary dealer-side floor and shift the near-term bias back to distribution. A close below the 20-day support at $689.65 would indicate the base formation has broken down entirely and the signal should be considered invalidated. On the fundamental side, any negative revision to the HBM supply agreement pipeline — particularly a pullback in NVIDIA's memory allocation for next-generation GPU builds — would materially change the demand picture the street is pricing in. Watch for downward EPS revisions: the current +75 net revision count is a tailwind; if that turns negative over the next 30 days, the fundamental leg of the thesis weakens. Finally, a broad semiconductor sector breakdown — SOXX losing key support — would context-override the individual stock signal regardless of MU-specific positioning.
Bottom Line
MU has fired a signal with a 57.5% positive-outcome rate across 678 backtested entries and a median +1.90% excess return vs. SPY over 20 trading days. The stock is not in breakout mode — it is in a bottoming attempt after a -37% drawdown from its 100-day highs, with the put wall at $750 serving as the near-term floor and 20-day resistance at $827.58 as the first real hurdle. MU's structural position in the semiconductor supply chain — an 8/10 bottleneck score, oligopoly memory moat, and direct HBM exposure to the AI infrastructure buildout — provides a fundamental backdrop that supports the setup holding. If $750 holds and the 5-day recovery extends toward $827, the signal plays out as designed. If $750 breaks on volume, step aside and wait for $689.65 to prove itself. We track this signal publicly with published hit rates because accountability is what separates signal-tracking from storytelling.
This article was generated by Tradestie Alpha Assistant using live market data (scanner signals, backtested hit rates, options positioning, and fundamentals). Backtest statistics describe historical cohorts, not guarantees. It is for informational purposes only and is not financial advice. Do your own research before making investment decisions.