Bottom line upfront: RTX (Raytheon Technologies) scores a 54/100 — a HOLD — and none of our backtest-validated buy signals are currently active on it. The Reddit buzz driving today's mention spike isn't even about the defense stock. Here's the full picture.
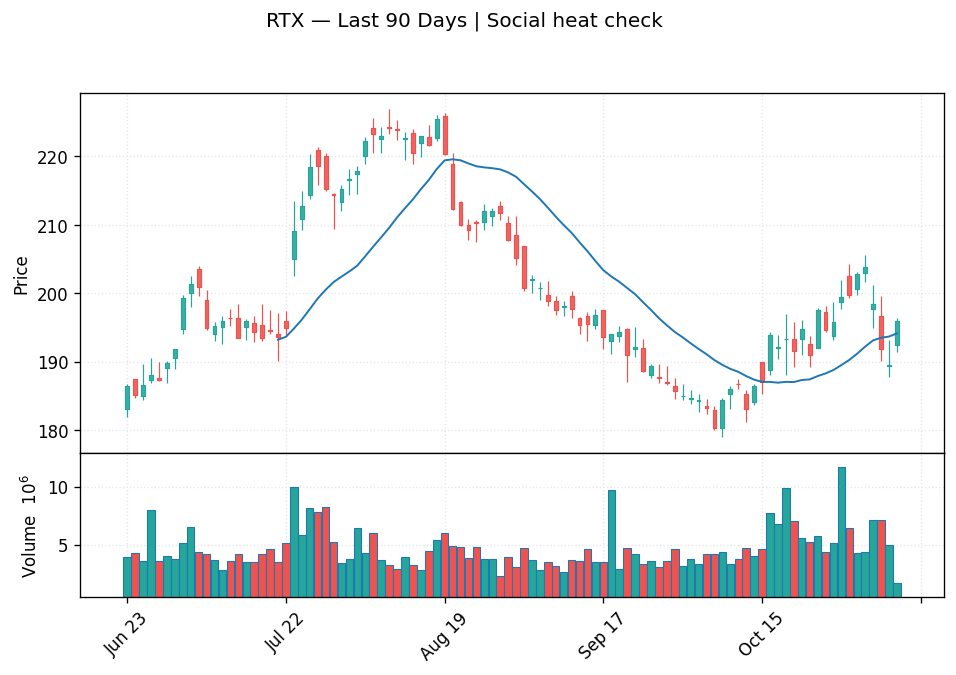
The Hype: A 13-Standard-Deviation Mention Spike
RTX mentions on Reddit surged to 13.0 standard deviations above its own 30-day baseline today — 5 comments versus a typical daily average of roughly 1. That kind of spike usually signals one of three things: a major earnings beat, a geopolitical catalyst, or a viral post from a high-follower account. In this case, it's none of the above.
A look at the actual Reddit comments tells the story immediately. The top posts today include "time to release RTX 6090" and "This must be the RTX 6090 teaser." These are discussions about Nvidia's next-generation consumer GPU — not about Raytheon Technologies (NYSE: RTX), the aerospace and defense contractor. Reddit's stock-ticker tagging system picked up the GPU brand name as a stock mention, inflating the count. The 13-standard-deviation spike is, in large part, a data artifact.
This matters because a lot of retail investors search "should I buy RTX" when they see a ticker trending. The correct answer requires separating the noise from the actual financial data — which is what the rest of this article does.
What Our Data Actually Says
Score and Recommendation: HOLD at 54/100
RTX currently carries a composite investment score of 54 out of 100, placing it squarely in hold territory. Breaking that down: the technical sub-score is 48, momentum is 50, and fundamentals come in at 51. The one genuinely bright spot in the score breakdown is options flow, which registers at 68 — suggesting that institutional options positioning leans constructive, even as the broader picture is neutral. None of our backtest-validated buy signals — which are designed to identify bases, pullback recoveries, and volume absorption setups — currently hold RTX.
Trend: Mixed Across Timeframes
The trendline picture at current price of roughly $195.38 is a study in conflicting timeframes:
- 5-day trend: DOWN — the stock is down approximately 4.1% over the past week and pressing near short-term resistance.
- 20-day trend: UP — a gain of roughly 6.8% over the past month, with support at $187.71 and resistance at $205.62.
- 100-day trend: Moderate downtrend — but RTX is trading above its 100-day mean, and relative strength on this timeframe is flagged as STRONG. Key support sits at $180.90, with resistance near $204.05.
The takeaway: the intermediate and longer-term trend is not broken, but the short-term tape is under pressure. The stock is currently sandwiched between near-term resistance in the $204–$206 range and 20-day support at $187.71. Neither bulls nor bears have a clean setup right now.
Options Positioning: Bullish Gamma Bias, But Watch the Walls
The options market is painting a relatively constructive picture. The call wall sits at $200 (9,282 contracts of open interest), and the put wall is at $190 (5,142 contracts). Market-maker gamma positioning is flagged as bullish, meaning dealers are likely to hedge in a way that provides a mild upward drift when the stock is trading between those two strikes. The MACD signal, however, is currently bearish, and RSI sits at a neutral 51.3 — not oversold enough to trigger a compelling mean-reversion entry.
The risk here is straightforward: the call wall at $200 represents a meaningful options-driven ceiling. With the stock at ~$195 and the 5-day trend negative, any failed attempt to clear $200 could quickly put the $190 put wall and then the $187.71 20-day support level in play. A close below $187.71 on elevated volume would materially weaken the intermediate-term setup.
Analyst Consensus: Bullish, But the Gap Is Wide
Wall Street is significantly more optimistic than the current price suggests. The analyst mean price target is $227.91, implying roughly +20.3% upside from current levels, with a median target of $235 and a high of $250. The ratings breakdown is 6 strong buys, 10 buys, and 8 holds — not a single sell or strong sell across 24 analysts. Current-year EPS estimates stand at $7.70, up from $6.29 a year ago (a 22% growth rate), and full-year revenue is forecast near $97.4 billion, growing roughly 10% year-over-year.
Critically, estimate revision momentum is strongly positive: 51 upward EPS revisions versus just 4 downward revisions over the past 30 days. That's the kind of earnings estimate acceleration that tends to precede multiple expansion — but only when the technical setup aligns.
The Level That Would Change Our Mind
Our validated buy signals are built around bases and controlled pullbacks — not chasing stocks near resistance. For RTX to generate a credible entry signal, one of two scenarios needs to develop:
- Pullback to support and base formation: A constructive pullback toward the $187–$188 range (the 20-day trendline support at $187.71), followed by at least a few sessions of tight price action and declining volume, would put RTX in the zone where our bottoming-style signals become relevant. That's approximately a 4% decline from current levels.
- Decisive breakout above resistance: A confirmed close above $205–$206 on above-average volume — clearing both the 20-day and 100-day resistance levels simultaneously — would shift the short-term trend to up and potentially activate momentum-continuation signals. The analyst target cluster above $225 would become a reasonable intermediate objective in that scenario.
Chasing the stock at $195 — in between support and resistance, with a negative 5-day trend — is the scenario our signals are specifically designed to avoid. The expected return from entries in "no man's land" is statistically poor versus waiting for a defined setup.
Key Levels at a Glance
| Level | Price | Significance |
|---|---|---|
| Call Wall | $200 | Options-driven ceiling; 9,282 contracts OI |
| 20-Day Resistance | $205.62 | Upper trendline boundary; breakout target |
| 100-Day Resistance | $204.05 | Secondary ceiling aligning with 20-day |
| Current Price | ~$195.38 | Between walls; no clean setup |
| Put Wall | $190 | Options-driven floor; 5,142 contracts OI |
| 20-Day Support | $187.71 | Key pullback buy zone |
| 100-Day Support | $180.90 | Deeper support; structural floor |
| Analyst Mean Target | $227.91 | +20.3% implied upside; 24 analysts |
Bottom Line
RTX is a fundamentally solid defense name with strong analyst conviction, accelerating EPS estimate revisions, and bullish options positioning — but at ~$195, it sits in technical no-man's land between its call wall ($200) and 20-day support ($187.71). The Reddit spike that brought you here was largely a ticker mix-up with Nvidia's GPU branding. The data says HOLD: wait for either a pullback and base near $187–$188, or a confirmed breakout above $205–$206, before initiating or adding to a position. The setup isn't here yet — but the fundamental case to own it when it arrives is real.
This article was generated by Tradestie Alpha Assistant using live market data (scanner signals, backtested hit rates, options positioning, and fundamentals). Backtest statistics describe historical cohorts, not guarantees. It is for informational purposes only and is not financial advice. Do your own research before making investment decisions.