Compute grew 106x since Pascal. Bandwidth grew 11x. The research frontier has already surrendered to this math — the market hasn't finished pricing it.
Every AI accelerator sold today is a memory-bandwidth business wearing a compute costume. The FLOPs are the brochure; the bytes are the product. This piece makes that claim with three datasets we run ourselves: a 3,407-part chip inventory crawled from vendor spec sheets, a daily research radar that tracks new academic publications and community attention, and our fundamentals store. The three tell one story, and the last chart shows the market has only priced half of it.
The arithmetic: 106x vs 10.9x
Start with the chip inventory. We track peak dense tensor FLOPs (no sparsity — vendor "with sparsity" figures are marketing doubling and we strip them) and peak memory bandwidth for every datacenter part in the database. Index NVIDIA's line to the P100, the chip that started the deep learning datacenter era in 2016:
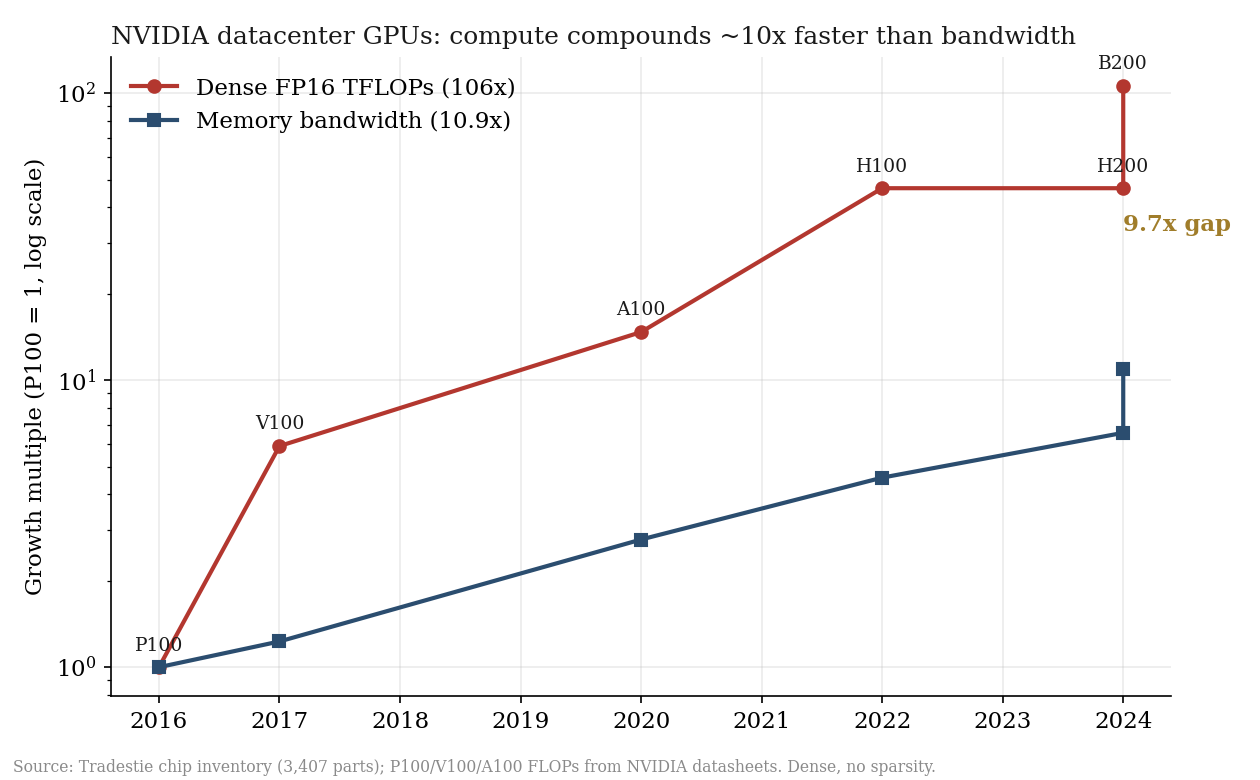
From P100 to B200, dense FP16-class compute grew 106x (21.2 TFLOPS → 2,250 TFLOPS). Memory bandwidth grew 10.9x (732 GB/s → 8 TB/s). Compute compounded roughly ten times faster than the memory system feeding it, for eight consecutive years.
The cleaner way to see it is bytes-per-FLOP: how many bytes of memory bandwidth the chip gives you for every FLOP of compute. If this number falls, the chip is more bandwidth-starved — more of its silicon sits idle waiting for data.
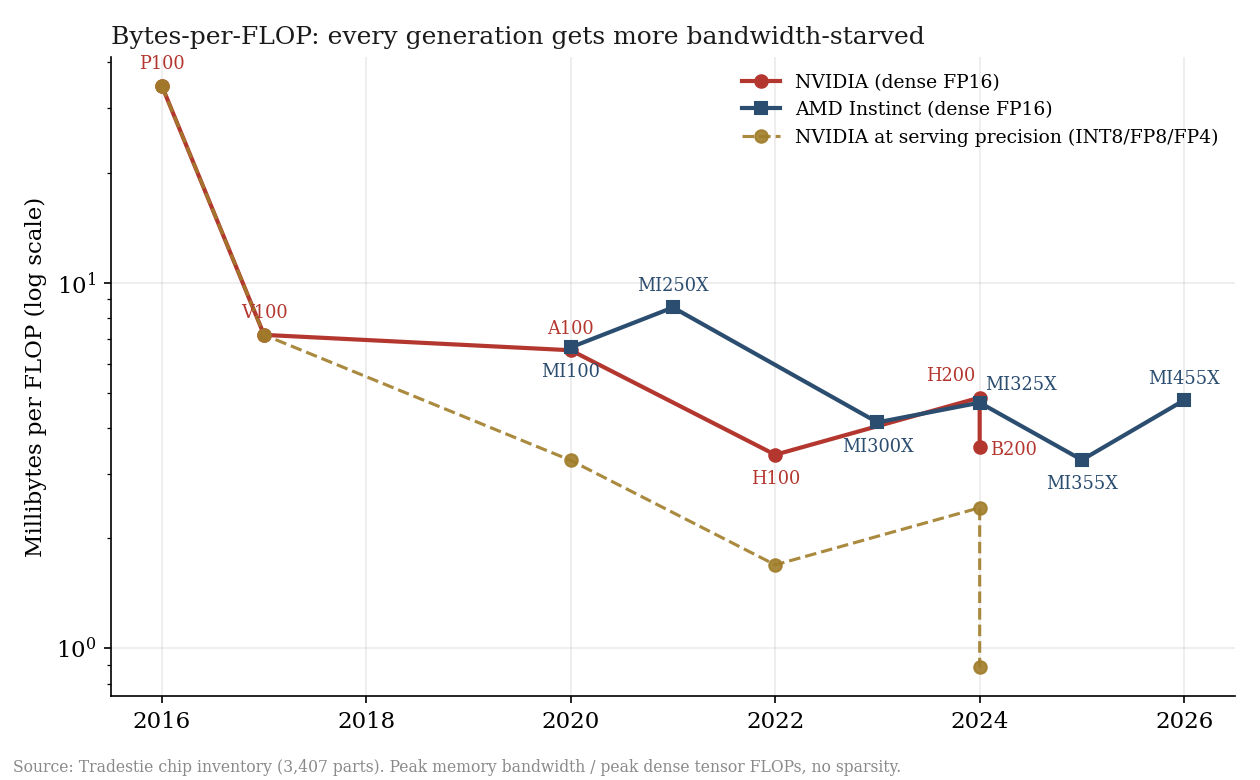
The numbers, at dense FP16, from our inventory:
| Chip | Year | Bandwidth | Dense FP16 | Bytes/FLOP |
|---|---|---|---|---|
| P100 | 2016 | 732 GB/s | 21.2 TF | 0.0345 |
| V100 | 2017 | 900 GB/s | 125 TF | 0.0072 |
| A100 80GB | 2020 | 2,039 GB/s | 312 TF | 0.0065 |
| H100 SXM | 2022 | 3,350 GB/s | 989.5 TF | 0.0034 |
| H200 SXM | 2024 | 4,800 GB/s | 989.5 TF | 0.0049 |
| B200 | 2024 | 8,000 GB/s | 2,250 TF | 0.0036 |
A 10x decline in bytes-per-FLOP from P100 to B200. And that flatters the modern chips, because nobody serves models at FP16 anymore. At the precision people actually run inference — INT8 on Ampere, FP8 on Hopper, FP4 on Blackwell — the effective ops-per-byte collapse is far steeper: P100 at 0.0345 bytes per op down to B200-at-FP4 at 0.00089, a 39x decline. Every FP4 op on a B200 gets one-fortieth the memory bandwidth a P100 op got.
AMD's Instinct line traces the identical slope: MI100 at 0.0067, MI300X at 0.0042, MI355X at 0.0033. Two vendors, two architectures, one wall.
The tell: vendors are shipping bandwidth refreshes
Look at what the H200 actually is. Same silicon as the H100 SXM — identical 989.5 TF dense FP16 in our inventory — with bandwidth raised from 3,350 to 4,800 GB/s. NVIDIA's biggest product refresh of 2024 added zero FLOPs and 43% more bandwidth, purchased entirely with more and faster HBM. AMD did exactly the same thing with the MI325X: identical 1,307 TF compute as the MI300X, bandwidth pushed from 5,427 to 6,144 GB/s.
When both vendors independently decide the way to sell more chips is to bolt on more memory and touch nothing else, they are telling you what the binding constraint is. You don't need our thesis; you can read theirs off the spec sheets.
And the forward roadmap escalates it: AMD's MI455X (July 2026 in our inventory) jumps to 23.9 TB/s of HBM4 bandwidth — a 2.9x single-generation leap, the largest in the dataset. At FP16 that actually restores bytes-per-FLOP to 0.0048, back to 2020 levels. Bandwidth is finally being bought back — and it is being bought with staggering quantities of stacked DRAM. That purchase order lands on the memory supply chain.
The research frontier already pivoted
If bandwidth is the wall, the smartest people in the field should be visibly climbing it. Our research radar — a daily scrape of new academic publication counts, trending-paper feeds, and tech community discussion — says they are, in unison.
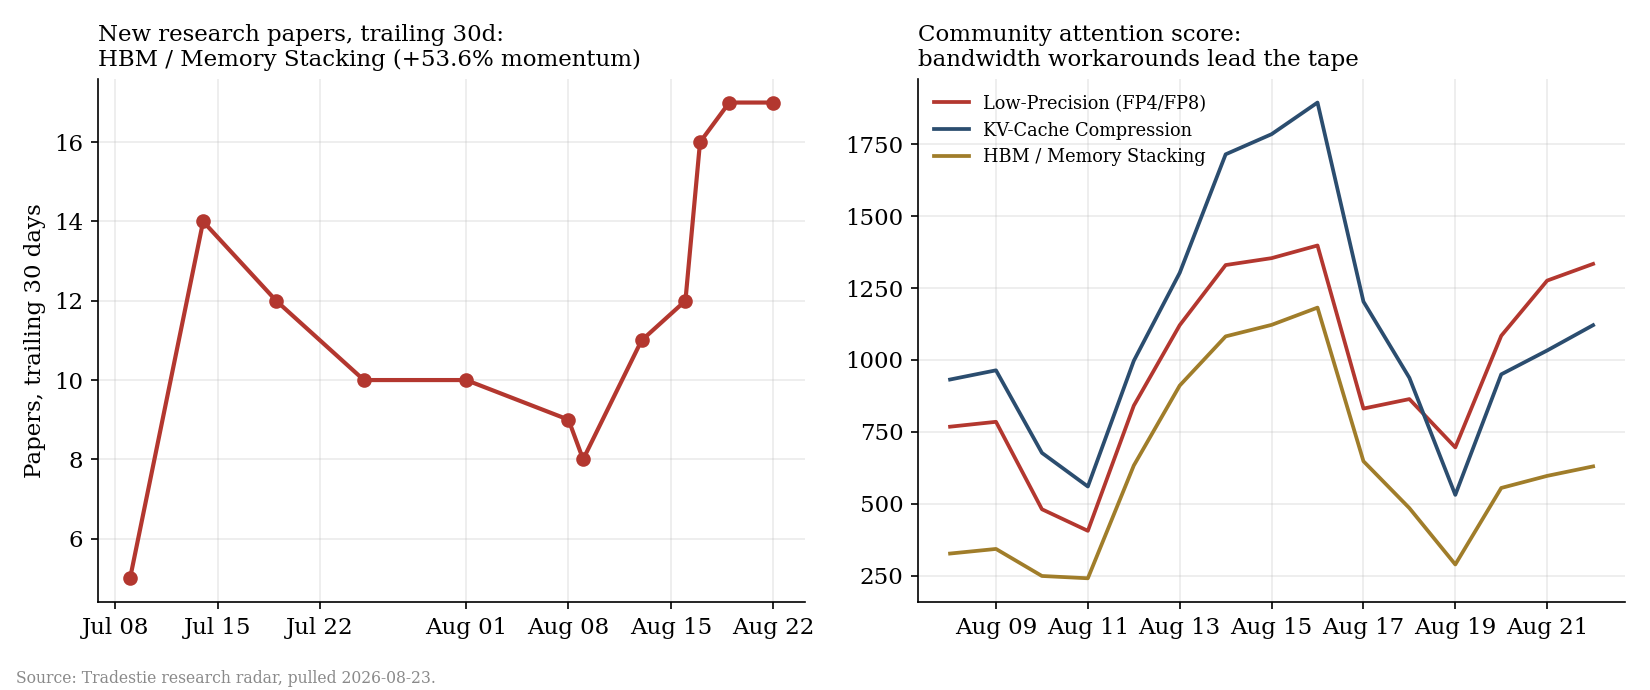
Three signals from the 2026-08-22 run:
Publication momentum. Trailing-30-day published-paper count for HBM / Memory Stacking went from 5 papers on July 9 to 17 on August 22 — a 3.4x rise; the scraper's smoothed momentum score puts it at +53.6%, one of only eight accelerating topics out of 33 tracked, alongside ALD deposition (+90.9%) and silicon photonics (+46.7%). Hardware researchers are piling into stacked memory.
Attention leadership. Rank every tracked topic by community attention score on August 22 and the entire podium is bandwidth-scarcity workarounds: Low-Precision Inference (FP4/FP8) at 1,334 (+30.9%, the #1 topic in the whole radar), LLM Efficiency at 1,171, KV-Cache / Attention Memory Compression at 1,121 (+16.6%). Quantization exists to move fewer bytes per op. KV-cache compression exists to hold fewer bytes resident. The most-read AI research on the internet right now is, functionally, a coping literature for the chart above.
Citation velocity. Among the fastest-cited recent papers our tracker follows: "Exploring High-Bandwidth Flash for Modern LLM Inference" — corporate-affiliated work on pushing inference weights out to flash because HBM capacity is too scarce and too expensive. Our tagger maps it to MU, AMKR, TSM, NVDA. When the workaround literature starts engineering around HBM's price, the pricing power is no longer hypothetical.
What the market pays for this
Now the fundamentals store, pulled 2026-08-23:
| Ticker | Price | Fwd P/E | Rev growth (YoY q) | Profit margin | Street target | Implied upside |
|---|---|---|---|---|---|---|
| MU | $966.78 | 6.0x | +345.7% | 55.9% | $1,502 | +55% |
| NVDA | $214.72 | 24.8x | +85.2% | 63.0% | $304 | +42% |
| TSM | $418.95 | 24.5x | +36.0% | 49.9% | $554 | +32% |
| AMKR | $50.26 | 23.8x | +25.6% | 7.5% | $77 | +53% |
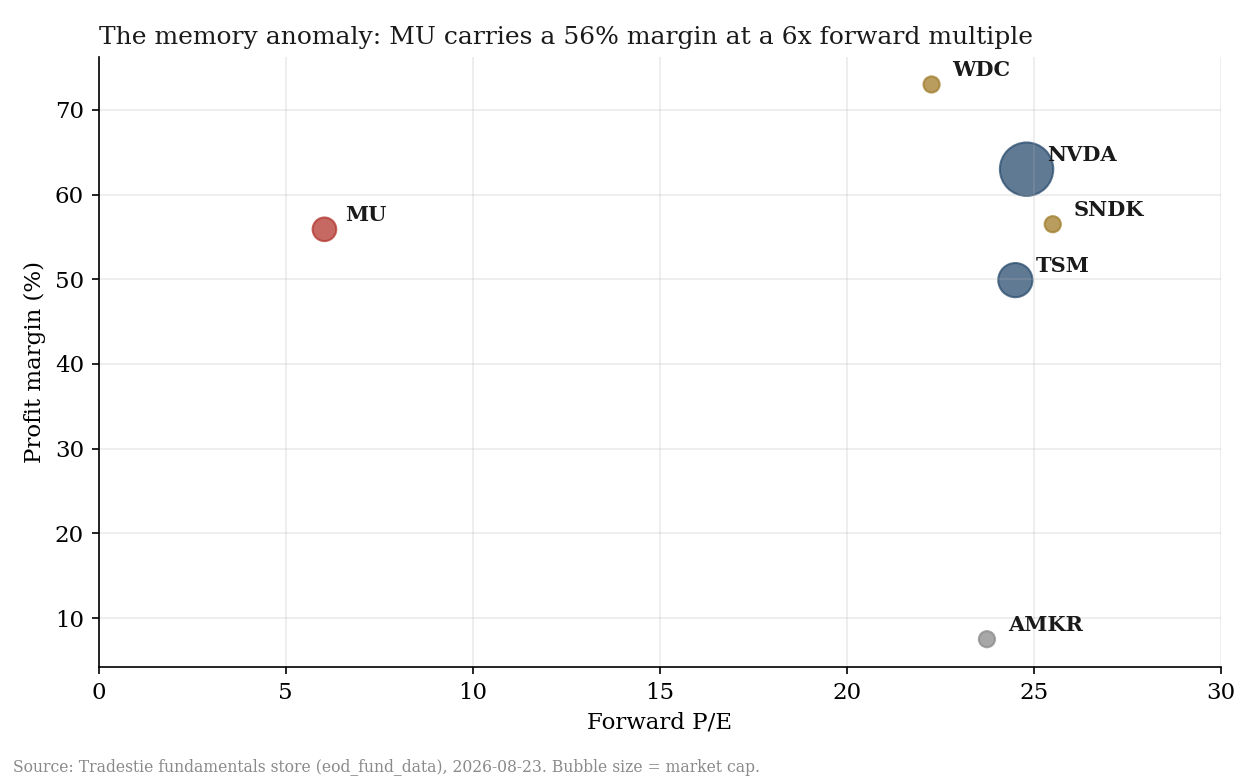
Micron is a $1.03 trillion company running a 55.9% profit margin — seven points below NVIDIA's, on a business the market still files under "commodity" — with revenue up 345.7% year over year, and it trades at 6.0x forward earnings. NVIDIA, TSMC, and Amkor all cluster at 24–25x. The market is pricing MU's forward earnings power — roughly $160 per share of NTM EPS implied by that multiple — as a cycle peak that will not repeat: a commodity earnings spike to be sold, not a toll booth to be owned.
That is the bet on the table. If HBM is a commodity, 6x is right and this is the top. If HBM behaves like the constraint asset of the AI buildout — sold out through multi-year supply agreements, priced against the value of unblocking a $40,000 GPU rather than against its own production cost, with three qualified suppliers and yield as the moat — then a 56% margin business at 6x forward is the cheapest large-cap expression of AI capex in the market. Everything above this paragraph — the 39x bytes-per-FLOP collapse, the bandwidth-only refreshes, the MI455X's 23.9 TB/s, the research field organizing itself around byte scarcity — argues the constraint is structural, not cyclical.
Two supporting observations from the same table. First, the market has already re-rated the NAND side: SanDisk trades at 25.5x forward and Western Digital at 22.3x with a 73% margin — the "memory is commoditized" discount has been abandoned there, but not for the DRAM/HBM pure play. Second, honesty requires noting that Amkor at 23.8x is not the neglected packaging play the bull case wants — with a 7.5% margin and 25.6% growth, the advanced-packaging story looks fairly priced. (Ignore its +53% street-target column: sell-side targets run optimistic across this whole table — the multiple-versus-margin combination is the tell, and AMKR's says fully priced.) The mispricing in this dataset is concentrated in one ticker.
NVIDIA's position is different but aligned: it owns the pricing power over the bottleneck — it decides how much HBM ships on each SKU and captures the spread — and at 24.8x forward with 85% growth it remains the toll collector on the whole chart. TSMC's CoWoS is the physical substrate every HBM stack must be bonded to; 24.5x for a 50%-margin monopoly on the base die is the boring compounder version of the thesis.
What would falsify this
We publish kill criteria or we're just cheerleading.
- HBM supply catches up. The MI455X's 2.9x bandwidth jump shows HBM4 capacity is coming in size. If Samsung closes the HBM4 yield gap and 2027 capacity overshoots demand, MU's 56% margin is the cycle top and 6x forward was correct. Watch: HBM contract pricing and MU margin guidance — the first sequential HBM ASP decline kills the structural argument.
- The algorithms escape. The workaround literature we cite as demand evidence is also the threat: if KV-cache compression, FP4 serving, and flash-offload (that high-bandwidth flash paper again) reduce bytes-per-token faster than models and context lengths grow, bandwidth demand decouples from AI demand. Watch: our attention radar — a sustained collapse in HBM paper momentum while efficiency topics keep climbing would be the leading indicator.
- The 345% comp is the anomaly. MU's revenue growth laps a weak year-ago quarter at supercycle pricing. If forward estimates (~$160 implied EPS) get revised down 30%+, the "cheap" multiple was an illusion of peak earnings. Watch: estimate revisions into the next two prints.
- Our own data caveats. Pre-Ampere NVIDIA FLOPs (P100, V100, A100) come from NVIDIA datasheets, not our crawler — the inventory's derived-metrics coverage starts at Hopper. The attention series is 33 days old and weekend-seasonal. The bytes-per-FLOP convention (peak dense, no sparsity) is stated, but peak specs are not delivered throughput.
Positioning
The bandwidth wall is the best-documented physical constraint in computing, the research field has reorganized around it, and the market prices its primary beneficiary like a fading commodity cyclical. MU at 6x forward is the asymmetry; NVDA and TSM at ~25x are the quality expressions; AMKR is on watch, not a buy at this multiple.
Go deeper on Tradestie: - Full AI scorecard and technicals: Micron on Investment Advisor - Trace every HBM dependency: Semiconductor Supply Chain Map - Get pieces like this first: subscribe to the Tradestie Daily Digest from your account settings.
Sources: Tradestie chip inventory (3,407 parts, vendor crawl); Tradestie research radar (33 topics, data through 2026-08-22); Tradestie fundamentals store (2026-08-23). Not investment advice.